Ethereum is trading below the $3,000 mark as it attempts to push higher and reclaim key structural levels needed to signal the start of a recovery. So far, those efforts have failed. Price remains capped by persistent resistance, and market confidence continues to deteriorate.
While short-term bounces have emerged, most analysts and investors expect the broader downtrend to continue, arguing that Ethereum lacks the demand and momentum required to sustain a meaningful reversal. Sentiment has turned deeply pessimistic, with traders increasingly positioned for further downside rather than recovery.
On-chain and technical data reinforce this cautious outlook. A recent CryptoQuant report shows that after Ethereum’s steep decline from its $4,800 peak, the price has become trapped in a narrow range centered around the $2,800 level for nearly a month. This zone has effectively turned into a state of market purgatory. Bulls have been unable to generate the conviction needed to reclaim higher highs, while bears have repeatedly failed to force a decisive breakdown below support.
The result is a prolonged phase of volatility compression. Price action has tightened, signaling widespread indecision among market participants and a lack of directional commitment. Historically, such compression often precedes a sharp move, but the direction remains uncertain.
Muted Layer-2 Flows Reflect Ethereum’s Stalemate
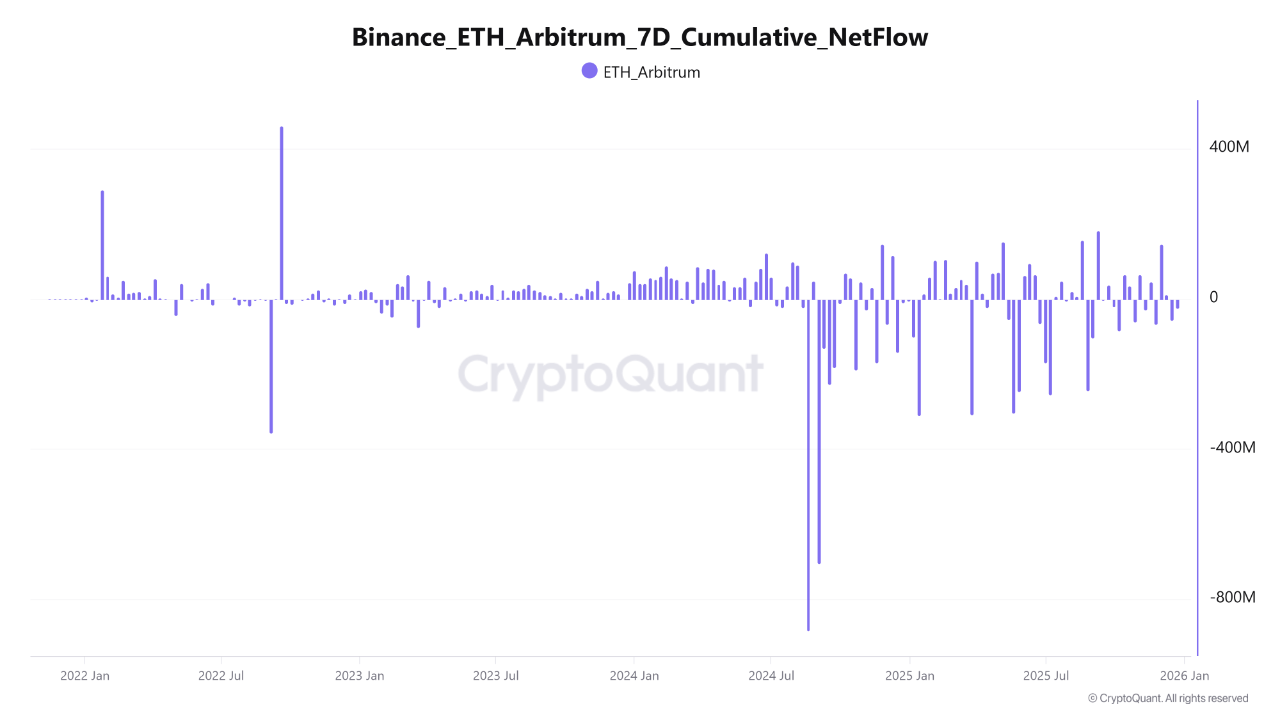
A recent report from CryptoOnchain highlights that Ethereum’s price stagnation is being closely mirrored by on-chain behavior. Weekly ETH netflows on Arbitrum, one of Ethereum’s most important Layer-2 networks and a common proxy for smart-money positioning and DeFi activity, remain subdued and highly choppy.
Rather than showing a clear inflow or outflow trend, the data reflects a market operating without strong conviction, reinforcing the idea that larger participants are choosing to remain on the sidelines.
This lack of directional flow suggests that capital is not aggressively entering or exiting the ecosystem. Instead, investors appear to be waiting for clearer macroeconomic signals or a definitive shift in market structure before committing.
In previous cycles, sustained expansions in Arbitrum netflows have often coincided with periods of renewed risk appetite or decisive trend changes. The current inactivity stands in sharp contrast to those environments.
The alignment between compressed price action around key support levels and dormant on-chain activity points to a buildup of latent energy within the market. Ethereum is effectively coiling. While this equilibrium can persist for extended periods, it rarely resolves quietly. When the balance breaks, moves tend to be swift and forceful.
Arbitrum netflow is now a critical metric to watch. A sudden and sustained expansion in flows could act as an early signal that this prolonged phase of indecision is nearing its resolution, potentially setting the direction for Ethereum’s next major move.
Ethereum Stabilizes Near $3,000 as Downtrend Pressure Persists
Ethereum is trading near the $2,970 level on the daily chart, attempting to stabilize after an extended decline from the $4,800 highs recorded earlier this cycle. While recent candles show modest recovery attempts, the broader structure remains fragile. ETH continues to print lower highs and lower lows, signaling that bearish momentum has not yet been invalidated despite short-term relief bounces.
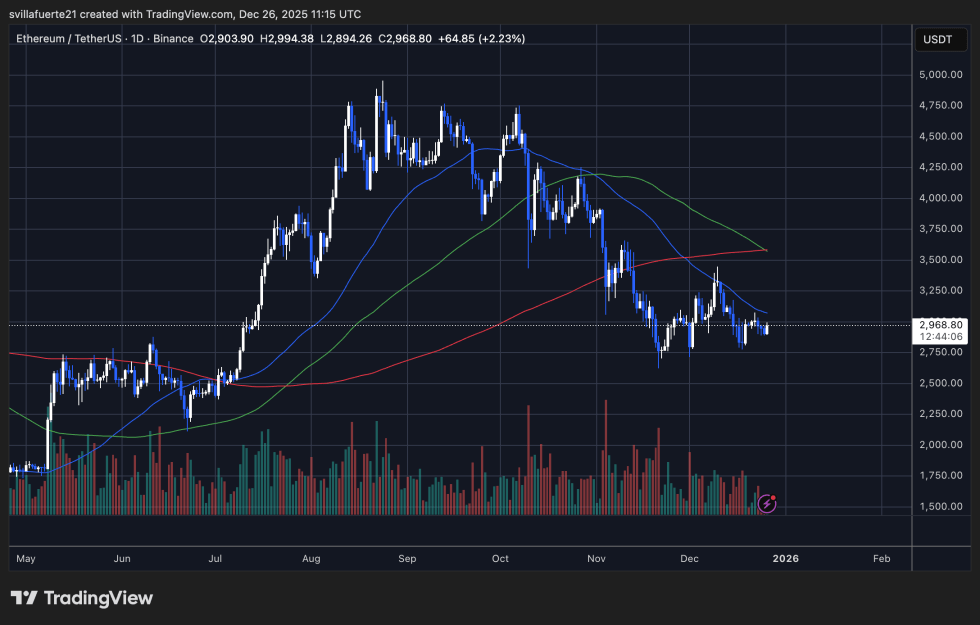
Technically, price remains below its key daily moving averages. The faster moving average has rolled over sharply and is acting as immediate resistance, while the 111-day and 200-day simple moving averages converge in the $3,300–$3,600 range. This cluster forms a heavy overhead supply zone, limiting the probability of a sustained upside move unless volume and momentum expand meaningfully.
The recent bounce from the $2,800–$2,900 area has helped Ethereum avoid a deeper breakdown for now. However, this move has occurred on relatively muted volume, suggesting a lack of conviction from buyers. In contrast, the initial leg lower was accompanied by strong selling pressure, reinforcing the idea that the dominant trend remains to the downside.
From a structural standpoint, the $2,800 level remains critical support. A decisive break below this zone would likely accelerate losses and confirm bearish continuation. Conversely, for Ethereum to shift momentum, price must reclaim $3,200–$3,300 and hold above its declining daily averages.
Featured image from ChatGPT, chart from TradingView.com